


2014 vs. 2024 Aluminum
Introduction
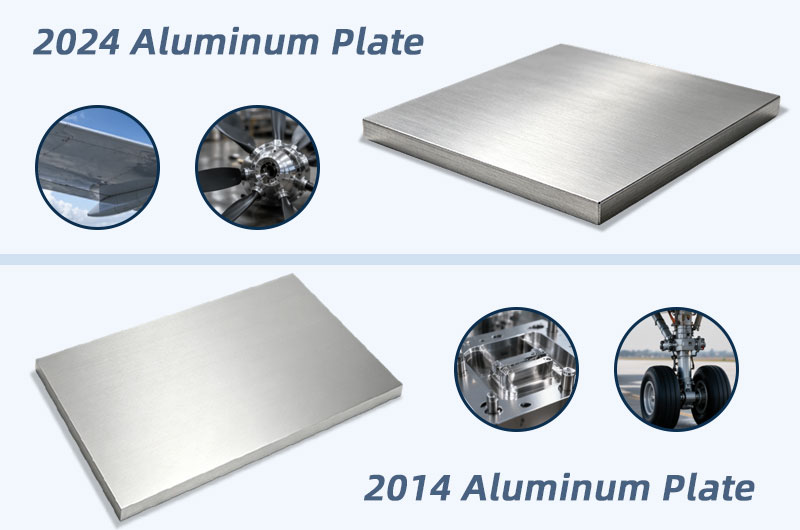
Among numerous industrial aluminum alloys, the 2014 and 2024 aluminum are two of the most representative high-strength aluminum alloys.
Both belong to the 2000 series aluminum-copper alloy family, have a similar appearance, and share a close price range, making them highly susceptible to confusion during material selection.
However, there are significant differences between the two in chemical composition, mechanical properties, processing characteristics, and application scenarios. Choosing the wrong material can, at best, affect product performance, and at worst, cause severe engineering hazards.
Quick Comparison Overview
Before delving into a detailed analysis, use the table below to quickly understand the core differences between the two, facilitating preliminary material selection.
| Comparison Item | 2024 Aluminum | 2014 Aluminum |
|---|---|---|
| Alloy System | Al-Cu-Mg System | Al-Cu-Si-Mg System |
| Primary Strengthening Elements | Copper + Magnesium | Copper + Silicon |
| Density | 2.78–2.80 g/cm³ | 2.80 g/cm³ |
| Typical Tensile Strength (T6) | 427–483 MPa | 483–490 MPa |
| Typical Yield Strength (T6) | 345–414 MPa | 414–420 MPa |
| Fatigue Strength | 138 MPa (Advantageous) | 124–130 MPa |
| Corrosion Resistance | Poor (Requires surface protection) | Poor (Requires surface protection) |
| Weldability | Poor (Riveting recommended) | Poor (Riveting recommended) |
| Machinability | Good (70%) | Excellent (70–80%) |
| Forging Performance | Fair | Excellent (Typical forging aluminum) |
| Max Operating Temp | Approx. 150°C | Approx. 210°C |
Alloy System and Chemical Composition
The Essential Difference in Alloy Systems
- 2024 aluminum belongs to the Al-Cu-Mg system, where magnesium is the most important strengthening element besides copper.
- 2014 aluminum belongs to the Al-Cu-Si-Mg system, where the addition of silicon is its most notable compositional feature distinguishing it from 2024.
It is this core difference—"Silicon vs. Magnesium"—that determines the fundamental divergence between the two alloys in strengthening mechanisms, heat treatment responses, and application scenarios.
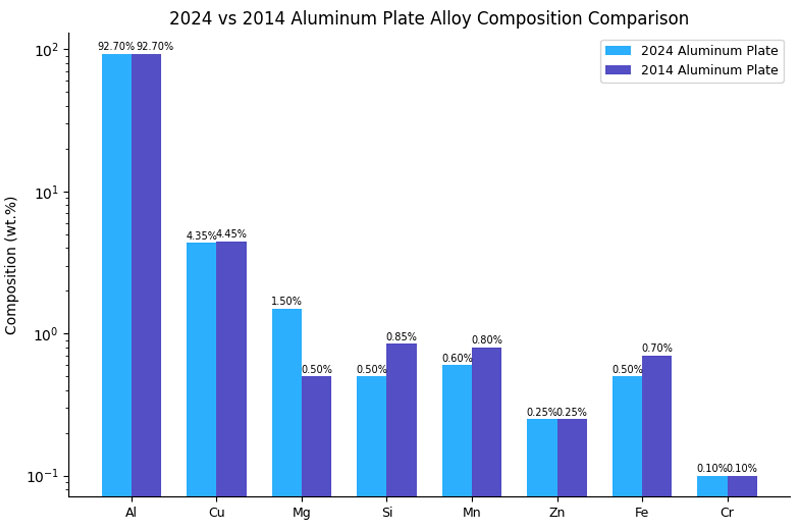
Chemical Composition Comparison
| Element | 2024 Aluminum | 2014 Aluminum | Explanation of Difference |
|---|---|---|---|
| Copper (Cu) | 3.8–4.9% | 3.9–5.0% | Similar, both are primary alloy elements |
| Magnesium (Mg) | 1.2–1.8% | 0.20–0.80% | 2024 has significantly higher Mg content |
| Silicon (Si) | ≤0.5% | 0.5–1.2% | 2014 has significantly higher Si content |
| Manganese (Mn) | 0.3–0.9% | 0.4–1.2% | Similar |
| Zinc (Zn) | ≤0.25% | ≤0.25% | Identical |
| Iron (Fe) | ≤0.50% | ≤0.70% | Similar |
| Chromium (Cr) | ≤0.10% | ≤0.10% | Identical |
| Aluminum (Al) | Remainder (Approx. 90.7–94.7%) | Remainder (Approx. 90.4–95%) | Similar |
Impact of Compositional Differences on Performance
- The higher magnesium content in 2024, combined with copper, forms the Al₂CuMg (S/S' phase) strengthening phase, endowing it with outstanding fatigue strength and damage tolerance.
- The higher silicon content in 2014 promotes the precipitation of CuAl₂ (θ' phase), which helps enhance overall strength and high-temperature stability while improving machinability and forging performance.
Simply put: 2024 excels in "anti-fatigue, " while 2014 excels in "anti-deformation" and "ease of machining."
In-Depth Mechanical Properties Comparison
Mechanical Properties in Various Heat Treatment Tempers
Mechanical properties vary significantly depending on the heat treatment temper. Below are the typical data for both alloys in common tempers.
Mechanical Properties of 2024 Aluminum (Various Tempers)
| Temper | Tensile Strength (MPa) | Yield Strength (MPa) | Elongation (%) | Hardness (HB) | Fatigue Strength (MPa) |
|---|---|---|---|---|---|
| O (Annealed) | 186 | 75.8 | 20 | 47 | 89.6 |
| T3 | 483 | 345 | 18 | 120 | 138 |
| T4/T351 | 469 | 324 | 16–19 | 120 | 138 |
| T6 | 427 | 345 | 5 | 125 | 124 |
| T851 | ≥455 | ≥400 | 4.9 | 140 | 117 |
Mechanical Properties of 2014 Aluminum (Various Tempers)
| Temper | Tensile Strength (MPa) | Yield Strength (MPa) | Elongation (%) | Hardness (HB) | Fatigue Strength (MPa) |
|---|---|---|---|---|---|
| O (Annealed) | 190 | 100 | 16 | 48 | 90 |
| T3 | 450 | 280 | 14 | 110 | 130 |
| T4/T451 | 430–440 | 270–330 | 14–15 | 110 | 140 |
| T6/T651 | 483–490 | 414–420 | 7–13 | 135–140 | 124–130 |
| T62 | 500 | 440 | 7.3 | 130 | 160 |
Fatigue Strength: The Core Advantage of 2024
Fatigue strength is one of the most significant performance differences between the two. The fatigue strength of 2024-T3 reaches 138 MPa (at 5×10⁸ cycles), performing exceptionally well in applications subjected to repeated cyclic loads.
This is precisely why 2024 has long been preferred over 2014 for components repeatedly subjected to takeoff and landing stresses, such as aircraft fuselage skins and wing spars.
Static Strength: Similar, but 2014 (T6) Has a Slight Edge
In their highest strength states (T6/T62), 2014-T62 can reach a tensile strength of 500 MPa and a yield strength of 440 MPa, slightly higher than the 483 MPa / 345 MPa of 2024-T3.
However, it should be noted that the elongation of 2014 in the T6 temper is only about 7%, whereas 2024-T3 has a high elongation of 18%. The two have distinctly different emphases regarding strength versus ductility/toughness.
Fracture Toughness and Damage Tolerance
- 2024 aluminum alloy has a fracture toughness (KIC) of about 35–40 MPa·m½ (T351 temper), demonstrating excellent resistance to crack propagation.
- 2014-T6 has a comparatively lower fracture toughness of about 19 MPa·m½.
For high damage-tolerance application scenarios, 2024 holds an obvious advantage, which is a key reason its status in main aviation structures remains unshakable.
Physical Properties Comparison
The basic physical parameters of the two alloys are similar, but there are notable differences in thermal conductivity and electrical conductivity.
| Physical Parameter | 2024 Aluminum | 2014 Aluminum |
|---|---|---|
| Density | 2.78–2.80 g/cm³ | 2.80 g/cm³ |
| Melting Point (Solidus) | 502°C | 507°C |
| Thermal Expansion Coeff. (20–100°C) | 23.2 µm/m·°C | 23.0 µm/m·°C |
| Thermal Conductivity (T3/T4) | 121 W/m·K | 150–159 W/m·K |
| Electrical Conductivity | 30% IACS | 38–40% IACS |
| Elastic Modulus | 72–73.1 GPa | 72–74 GPa |
| Poisson's Ratio | 0.33 | 0.33 |
| Maximum Operating Temp | Approx. 150°C | Approx. 210°C |
Special attention should be paid to thermal conductivity and maximum operating temperature:
- The thermal conductivity of 2014 (approx. 150–159 W/m·K) is significantly higher than that of 2024 (approx. 121 W/m·K), giving 2014 the upper hand in conditions requiring efficient heat dissipation.
- The maximum operating temperature of 2014 (approx. 210°C) is also higher than that of 2024 (approx. 150°C), making 2014 more reliable for applications in high-temperature environments.
Heat Treatment Process Comparison
Strengthening Mechanism Differences
Both alloys are heat-treatable aluminum alloys, but their strengthening phases differ:
- The primary strengthening phases of 2024 are Al₂CuMg (S/S' phase) and Al₂Cu (θ/θ' phase).
- The primary strengthening phase of 2014 is CuAl₂ (θ' phase). The presence of silicon helps stabilize the precipitation strengthening effect, improving strength retention at high temperatures.
Heat Treatment Process Parameters Comparison
| Process Step | 2024 Aluminum | 2014 Aluminum |
|---|---|---|
| Solution Treatment Temp | 493°C | 495–505°C |
| Quenching Method | Water Quench | Water Quench |
| Natural Aging (T4) | Room temp, ≥96h | Room temp, 96h |
| Artificial Aging Temp (T6) | 191°C, 8–16h | 160°C, 18h (for plates) |
| Annealing Temp | 413°C | 413°C |
| Full Annealing Cooling | Air cooling | Furnace cooling to 300°C, then air cooling |
High-Temperature Performance Differences
Temperature has a significant impact on the mechanical properties of both alloys. The following data on the strength variations of 2024-T3 at different temperatures can serve as an important reference for material selection under high-temperature conditions.
| Temperature | 2024-T3 Tensile Strength (MPa) | 2024-T3 Yield Strength (MPa) | Elongation (%) |
|---|---|---|---|
| -196°C | 586 | 427 | 18 |
| -80°C | 503 | 359 | 17 |
| 24°C (Room Temp) | 483 | 345 | 17 |
| 100°C | 455 | 331 | 16 |
| 149°C | 379 | 310 | 11 |
| 204°C | 186 | 138 | 23 |
| 260°C | 76 | 62 | 55 |
| 371°C | 34 | 28 | 100 |
- 2024's strength begins to drop significantly when temperatures exceed 125°C, and prolonged use above 150°C is not recommended.
- 2014's maximum operating temperature can reach 210°C, maintaining more stable mechanical properties under mid-temperature conditions.
This difference makes 2014 more competitive in applications requiring temperature resistance, such as forgings, molds, and hydraulic components.
Processing Characteristics Comparison
Machinability
Both alloys have good machinability and are considered machining-friendly among aluminum alloys.
- 2024 (T3/T4 tempers) has a machinability rating of about 70% (using 2011 alloy as a 100% baseline), making it suitable for high-precision parts. In the annealed (O) temper, its machinability drops to 30%, and direct machining is not recommended.
- 2014 has a machinability rating of 70–80%, slightly better than 2024. It performs well in both annealed and heat-treated tempers. When paired with cutting fluids (light oil or kerosene), excellent surface finishes can be achieved.
Conclusion: The machinability of 2014 is overall slightly superior to 2024, making it suitable for higher precision or more complex machining scenarios.
Weldability
This is a shared weakness for both alloys. Traditional fusion welding (TIG/MIG) is not recommended. High copper content leads to an extremely high risk of hot cracking, and the strength in the heat-affected zone will severely degrade.
Both alloys support the following joining methods:
- Resistance Welding (Spot/Seam): Performs excellently and is the recommended thermal joining method.
- Friction Stir Welding (FSW): Feasible. The joint efficiency of 2024 FSW is ≥90%, and the joint strength of 2014-T6 FSW can reach 78% of the base metal.
- Riveting: The most common and reliable connection method for both alloys, particularly prevalent in aerospace structures.
Formability
- 2024 exhibits relatively good formability in the annealed (O temper) and freshly quenched states, making it suitable for stamping and bending. However, forming becomes difficult after heat treatment.
- 2014 has poor cold formability and is prone to cracking on tight bend radii. It is recommended to perform forming operations in the T3/T4 temper or utilize hot forming processes.
Forging Performance: 2014's Distinctive Advantage
This is one of the most significant processing differences between the two.
- 2014 is classified as both a hard aluminum alloy and a forging aluminum alloy. It possesses excellent forging performance, with a recommended forging temperature range of 400–450°C (pre-heating for hot forging).
- 2024 is typically supplied in the form of extrusions and plates and is rarely used for forging. Its application in forgings is notably inferior to 2014.
Note: Southwest Aluminum has successfully developed aircraft landing gear system precision wheel die forgings using 2014 alloy, which is a classic successful case of 2014 in the field of aerospace precision forging.
Corrosion Resistance and Surface Treatment
Shared Weakness: Poor Corrosion Resistance
Due to their high copper content, both alloys exhibit poor corrosion resistance, which is a common characteristic of Al-Cu alloys. Both are susceptible to pitting and galvanic corrosion in humid environments or those containing chloride ions (like marine environments).
2024 in T3/T4 tempers faces the risk of Stress Corrosion Cracking (SCC); 2014 in artificially aged tempers tends to suffer from intergranular corrosion. Special care must be taken during use.
Protection Measures
Both alloys offer Alclad versions to balance strength and corrosion resistance for aerospace. For surface treatments, 2014 excels in hard anodizing and plating. In contrast, 2024 requires anodizing with NaAlO₂ sealing for optimal protection. Both alloys support painting.
| Surface Treatment Method | 2024 Aluminum | 2014 Aluminum |
|---|---|---|
| Protective Anodizing | Good | Good |
| Hard Anodizing | Fair | Good (Advantage) |
| Electroplating | Fair | Excellent (Advantage) |
| Alclad | Supported | Supported |
| Painting / Coating | Supported | Supported |
Typical Application Scenarios Comparison
Aerospace Sector
2024 Aluminumis one of the most heavily used hard aluminum alloys in the aviation industry, earning the title of the "Aviation Alloy."
Its core advantages lie in high fatigue strength and excellent damage tolerance, mainly applied in:
- Aircraft skins, fuselage frames, wing spars, bulkheads, and other main load-bearing structural components subjected to cyclic loads, as well as rivets and missile components.
- In military aviation, 2024 and its derivatives (2324, 2624) are defined as high damage-tolerance aluminum alloys, used in critical areas like the lower surface of wings.
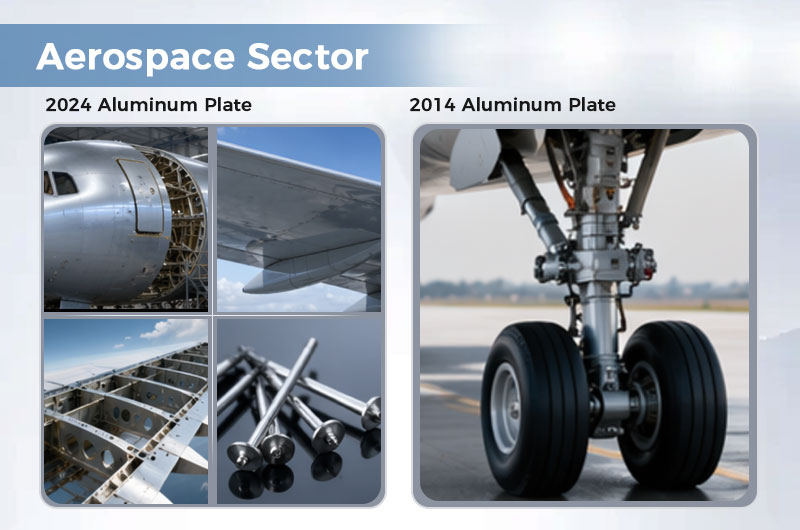
2014 Aluminumin aerospace is predominantly used for heavy forgings, with the typical representative being precision wheel die forgings for aircraft landing gear systems.
Landing gears must endure instantaneous high-impact forces, variable loads, and large temperature differentials. 2014's high static strength, good thermal stability, and excellent forging capabilities make it the ideal material for this scenario.
Military and Defense
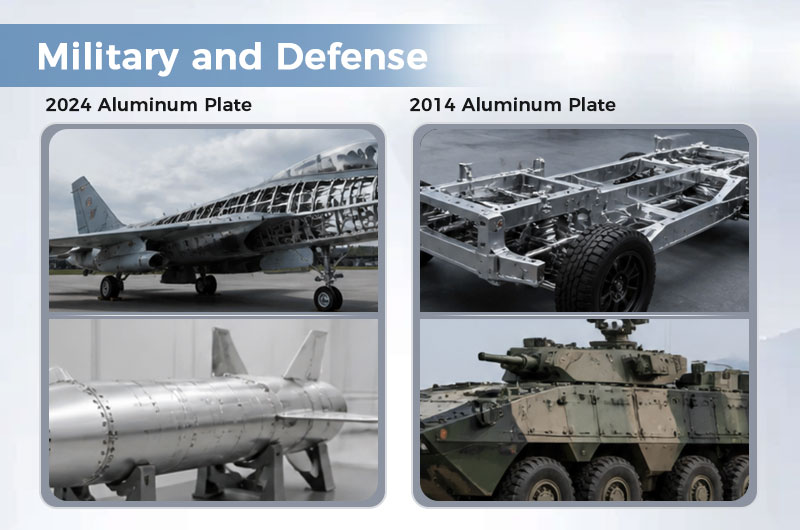
- 2024 is widely used in missile bodies and military aircraft structural parts where fatigue performance requirements are extremely high.
- 2014 is more commonly used in military vehicle chassis, suspension systems, armored vehicle structural components, and weapon manufacturing, where its excellent machinability and high static strength are fully utilized.
Transportation
Both alloys are widely used in truck wheels, frames, and suspension systems. For high-strength machine parts, hydraulic valve bodies, and mold manufacturing, 2014 is more favored due to its superior machinability and higher hardness (T6 temper HB 135–140).
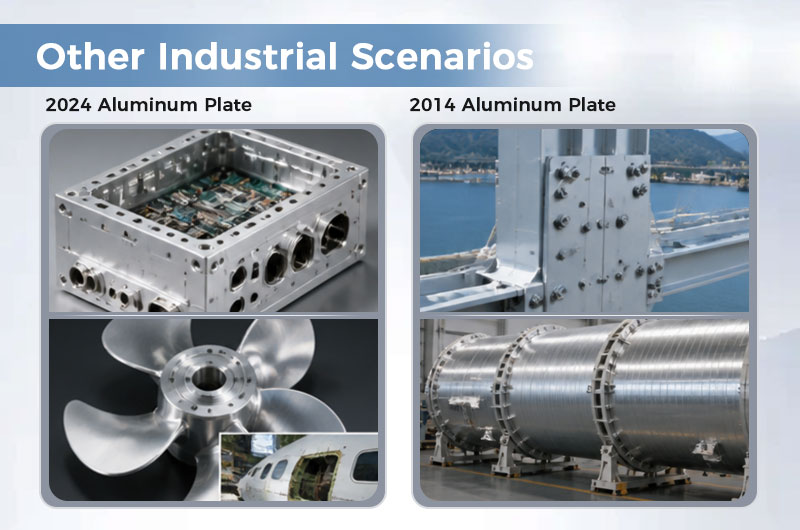
Other Industrial Scenarios
- 2024 is also applied in precision instruments, critical electronic equipment components, propeller elements, and civil aircraft structural repairs.
- 2014 is widely used in precision mechanical parts, hydraulic equipment, bridge structural components, and multi-stage rocket fuel tanks. Its higher upper operating temperature limit (210°C) gives it an irreplaceable advantage in hot environment conditions.
Material Selection Decision Guide
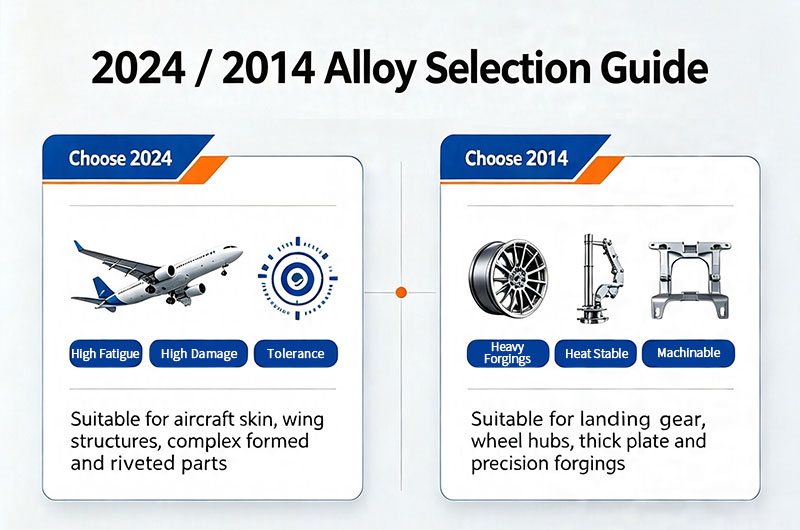
Faced with two alloys that have similar performance but different focuses, how do you make the right choice? Below are selection recommendations compiled by Worthwill based on years of supply experience.
Prioritize 2024 Aluminum when:
- The application demands extremely high fatigue strength (e.g., aircraft skins, wing structures).
- Excellent damage tolerance is required; the structure strictly prohibits "sudden failure/fracture."
- Operating temperatures do not exceed 150°C, shapes are complex, and good formability is needed.
- A large amount of riveting is required, and weight reduction requirements are strict.
Prioritize 2014 Aluminum when:
- Manufacturing heavy forgings, thick plates, or precision die forgings (e.g., landing gears, wheels).
- The application involves high-precision machining with high demands on processing efficiency and surface quality.
- Operating temperatures are between 150–210°C, requiring better thermal stability.
- Electroplating or hard anodizing is required, demanding strong surface treatment capabilities.
| Selection Dimension | Recommend 2024 | Recommend 2014 |
|---|---|---|
| Fatigue Performance Priority | ✓ | |
| Static Strength Priority | ✓ | |
| Forging Manufacturing | ✓ | |
| Sheet Metal / Skins | ✓ | |
| Precision Machining | ✓ | |
| Operating Temp > 150°C | ✓ | |
| High Damage Tolerance Req. | ✓ | |
| Surface Plating/Coating Need | ✓ |
Why Choose Worthwill
Henan Worthwill Industry Co., Ltd. is a professional enterprise dedicated to the supply of aluminum alloy plates, bars, and related aluminum products.
Our company provides a long-term supply of 2000 series high-strength aviation aluminum alloys, such as 2024 and 2014 aluminum plates, as well as a full range of aluminum alloy products from the 1000 to 8000 series. We can provide multiple heat treatment tempers, specifications, dimensions, and surface treatment solutions tailored to customer needs.
If you need to inquire about product specifications, pricing, or require technical support, please feel free to contact the professional team at Worthwill. We are committed to providing reliable aluminum material solutions for global buyers and engineers.
Appendix: 2014 vs. 2024 Aluminum Performance Data Summary
A. Chemical Composition Comparison (Mass Fraction %)
| Element | 2024 (AA Standard) | 2014 (AA Standard) |
|---|---|---|
| Aluminum (Al) | 90.7–94.7 (Remainder) | 90.4–95 (Remainder) |
| Copper (Cu) | 3.8–4.9 | 3.9–5.0 |
| Magnesium (Mg) | 1.2–1.8 | 0.20–0.80 |
| Silicon (Si) | ≤0.50 | 0.50–1.20 |
| Manganese (Mn) | 0.30–0.90 | 0.40–1.20 |
| Iron (Fe) | ≤0.50 | ≤0.70 |
| Zinc (Zn) | ≤0.25 | ≤0.25 |
| Chromium (Cr) | ≤0.10 | ≤0.10 |
| Titanium (Ti) | ≤0.15 | ≤0.15 |
B. Physical Properties Comparison
| Parameter | 2024 Aluminum | 2014 Aluminum |
|---|---|---|
| Density | 2.78–2.80 g/cm³ | 2.80 g/cm³ |
| Solidus Temp | 502°C | 507°C |
| Liquidus Temp | 638°C | 638°C |
| Thermal Expansion Coeff. (20–100°C) | 23.2 µm/m·°C | 23.0 µm/m·°C |
| Thermal Conductivity (T3 Temper) | 121 W/m·K | 150–159 W/m·K |
| Electrical Conductivity | 30% IACS | 38–40% IACS |
| Elastic Modulus | 72–73.1 GPa | 72–74 GPa |
| Shear Modulus | 28 GPa | 27–28 GPa |
| Poisson's Ratio | 0.33 | 0.33 |
| Specific Heat Capacity | 0.875 J/g·°C | 0.870–0.880 J/g·°C |
| Max Operating Temp | ~150°C | ~210°C |
C. Mechanical Properties of 2024 Aluminum (Various Tempers)
| Temper | Tensile Strength (MPa) | Yield Strength (MPa) | Elongation (%) | Hardness (HB) | Fatigue Strength (MPa) | Shear Strength (MPa) |
|---|---|---|---|---|---|---|
| O | 186 | 75.8 | 20 | 47 | 89.6 | 124 |
| T3 | 483 | 345 | 18 | 120 | 138 | 283 |
| T4/T351 | 469 | 324 | 16–19 | 120 | 138 | 283 |
| T6 | 427 | 345 | 5 | 125 | 124 | 283 |
| T361 | 496 | 393 | 13 | 130 | 124 | 290 |
| T851 | ≥455 | ≥400 | 4.9 | 140 | 117 | 296 |
| T8 | 510 | 430 | 8 | — | — | — |
D. Mechanical Properties of 2014 Aluminum (Various Tempers)
| Temper | Tensile Strength (MPa) | Yield Strength (MPa) | Elongation (%) | Hardness (HB) | Fatigue Strength (MPa) | Shear Strength (MPa) |
|---|---|---|---|---|---|---|
| O | 190 | 100 | 16 | 48 | 90 | 130 |
| H111 | 210 | 110 | 14 | — | 93 | 130 |
| T3 | 450 | 280 | 14 | 110 | 130 | 270 |
| T351/T3510/T3511 | 430 | 320–330 | 6.7–6.8 | — | 120 | 250 |
| T4/T42/T451 | 430–440 | 250–330 | 14–15 | 110 | 130–140 | 260 |
| T4510/T4511 | 400–410 | 270 | 10–11 | — | 130 | 240 |
| T6/T651 | 483–490 | 414–420 | 7–13 | 135–140 | 124–130 | 290 |
| T6510/T6511 | 480 | 400 | 6 | — | 140 | 280 |
| T62 | 500 | 440 | 7.3 | 130 | 160 | 290 |
| T652 | 460 | 390 | 1.5 | — | 120 | 260 |
E. Direct Comparison of 2014 and 2024 Mechanical Properties (Typical T6 Values)
| Performance Indicator | 2024-T3 | 2024-T6 | 2014-T6 | 2014-T62 |
|---|---|---|---|---|
| Tensile Strength (MPa) | 483 | 427 | 483–490 | 500 |
| Yield Strength (MPa) | 345 | 345 | 414–420 | 440 |
| Elongation (%) | 18 | 5 | 7–13 | 7.3 |
| Hardness (HB) | 120 | 125 | 135–140 | 130 |
| Fatigue Strength (MPa) | 138 | 124 | 124–130 | 160 |
| Shear Strength (MPa) | 283 | 283 | 290 | 290 |
| Fracture Toughness (MPa·m½) | 35 (T351) | — | 19 (T651) | — |
F. International Standard Designations Equivalent
| Standard System | 2024 Aluminum Alloy | 2014 Aluminum Alloy |
|---|---|---|
| China (GB) | 2A12 | 2A14 |
| USA (AA/ASTM) | 2024 | 2014 |
| Japan (JIS) | A2024 | A2014 |
| Europe (EN) | EN AW-2024 | EN AW-2014 / 2014A |
| ISO | AlCu4Mg1 | AlCu4SiMg |
| Germany (DIN) | AlCuMg2 | AlCuSiMn / 3.1255 |
| France (AFNOR) | A-U4G1 | A-U4SG |
| UNS | A92024 | A92014 |